 IoT-based environmental monitoring (EIoT) systems usually bring the most value to medium- to longer-term projects. zThe upfront capital cost of sensors, gateways, and system design and installation have previously prevented the use of remote environmental monitoring systems — but not for one ingenious team.
The staff at the University of Queensland (UQ) have deployed a low-cost water turbidity sensor commonly used in washing machines to accurately measure sediment loads in recent events. Though their solution was a response to Cyclone Yasi over ten years ago, the learnings still ring true today.
In this article, we discuss UQ’s low-cost water quality monitoring tools and the pros and cons of ad-hoc IoT fluvial monitoring.
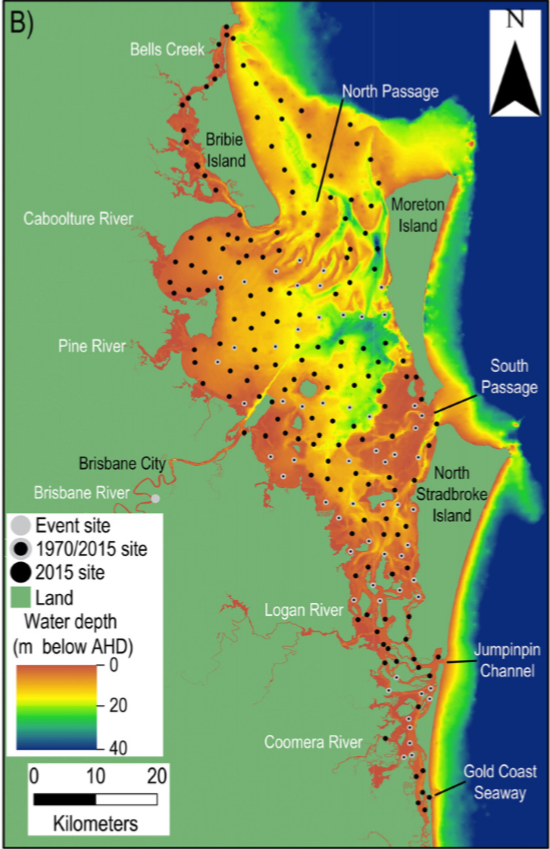
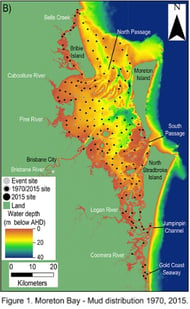
 The team at UQ was seeking the source of fluvial mud deposited over a 460 km2 area in Moreton Bay that could not be accounted for using historical river turbidity data. The data is historically sparse because:
- Fluvial total suspended sediment (TSS)/turbidity is notoriously challenging to measure
- Fluvial turbidity is a very short, intense, rare event.
A series of floods hit Brisbane starting in November 2010, culminating in Tropical Cyclone Yasi. The floods forced the evacuation of thousands of people across 90 towns, affecting 200,000 residents. Damage equated to A$2.38 billion and reduced Australia’s GDP by A$30 billion.
On 30 January 2011, Category 5 Cyclone Yasi made landfall in Northern Queensland. Extremely low-pressure, it hovered over a gigantic area for 22 hours, producing mass rainfall over a week of up to 140mm per day in some locations. Wind gusts over 285 km/h were recorded, resulting in A$3.5 billion of damage.
Environmental monitoring hardware and river sampling stations were destroyed, carrying decades of sedimentation equivalent in days. The soil erosion, sediment transport, and discharge had a significant impact on critical infrastructure and environment. Mud became the main soil component of Moreton Bay and the Port of Brisbane was nearly blocked with mud.
To this day, Cyclone Yasi has left a legacy on affected communities. So what’s the preventative course of action?
Exploring the business model for turbidity sensing
The business case for deploying expensive automatic sampling stations over a catchment area of 20,000 km2 is a tough one. This is largely because each station can cost up to about A$75,000 fitted. Since the event may occur over three to four days per decade, such stations are very exposed to physical damage. Flow profiles can change in seconds while measurements are taken every 15 to 30 minutes.
So why not use turbidity sensors as water quality monitoring tools that continuously monitor?
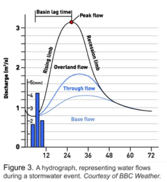
At face value, turbidity sensors are an ideal solution, presenting a much finer, and much more thorough picture of the peak flow event, as seen below.
The team at UQ was seeking the source of fluvial mud deposited over a 460 km2 area in Moreton Bay that could not be accounted for using historical river turbidity data. The data is historically sparse because:
- Fluvial total suspended sediment (TSS)/turbidity is notoriously challenging to measure
- Fluvial turbidity is a very short, intense, rare event.
A series of floods hit Brisbane starting in November 2010, culminating in Tropical Cyclone Yasi. The floods forced the evacuation of thousands of people across 90 towns, affecting 200,000 residents. Damage equated to A$2.38 billion and reduced Australia’s GDP by A$30 billion.
On 30 January 2011, Category 5 Cyclone Yasi made landfall in Northern Queensland. Extremely low-pressure, it hovered over a gigantic area for 22 hours, producing mass rainfall over a week of up to 140mm per day in some locations. Wind gusts over 285 km/h were recorded, resulting in A$3.5 billion of damage.
Environmental monitoring hardware and river sampling stations were destroyed, carrying decades of sedimentation equivalent in days. The soil erosion, sediment transport, and discharge had a significant impact on critical infrastructure and environment. Mud became the main soil component of Moreton Bay and the Port of Brisbane was nearly blocked with mud.
To this day, Cyclone Yasi has left a legacy on affected communities. So what’s the preventative course of action?
 Exploring the business model for turbidity sensing
The business case for deploying expensive automatic sampling stations over a catchment area of 20,000 km2 is a tough one. This is largely because each station can cost up to about A$75,000 fitted. Since the event may occur over three to four days per decade, such stations are very exposed to physical damage. Flow profiles can change in seconds while measurements are taken every 15 to 30 minutes.

So why not use turbidity sensors as water quality monitoring tools that continuously monitor?
At face value, turbidity sensors are an ideal solution, presenting a much finer, and much more thorough picture of the peak flow event, as seen below.
Differential data capture efficiency curves. EIoT (blue) vs. sampling stations (red).
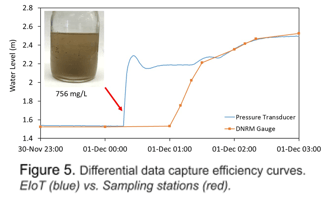 The problem is that a dedicated sensor measuring only turbidity (as opposed to sampling stations) remains very expensive.
And an environmental engineer installing water turbidity sensors worth $10,000 each will be extremely selective about where and how many to deploy, which can also limit results. Having more sensor points is also better for system resilience.
So, UQ tried an ingenious idea: deploying ad-hoc networks using A$9.90 dishwasher sensors.
Simon Albert, UQ civil engineering, modelling a low-cost EIoT node.
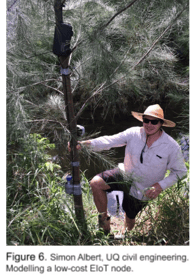 No sense in engineering a solution, however cost-effective, if it is washed away during peak flow. As it turns out, it is preferable to have seven $9.90 turbidity sensors cable-tied to trees at branch height than one large monitoring station in the area — especially when the station was washed away by the last event.
UQ engineers designed a turbidity monitoring node consisting of a dishwasher turbidity sensor, a TSS logger, a single-stage sampler, and a time-lapse camera for a total cost of less than US$420.
The pros of ad-hoc, IoT fluvial TSS monitoring
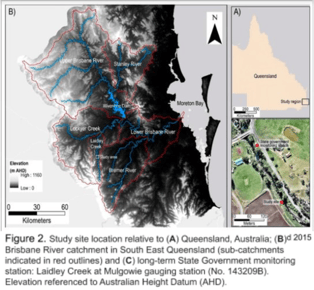
Seven sensors were deployed across an elevation gradient on the stream bank of Laidley Creek in Queensland, Australia, and two of these nodes successfully characterized the near-bed suspended sediment dynamics across a major flood event.
Near-bed TSS concentrations were closely related to stream flow, with the contribution of suspended bed material dominating the total suspended load during peak flows. Sedimentation data measured through these cheap sensors was multiple times more accurate (and larger) than historical data from expensive sampling stations.
“You can ask different questions,” explains Alistair Grinham, a researcher at the University of Queensland and mentor at UQ’s Turbidity Challenge. “What is the concentration profile during ‘X’ event, for example?"
This approach is also a useful way of separating different sediment-type loading events. You can get a much better signal-to-noise ratio at higher concentrations.
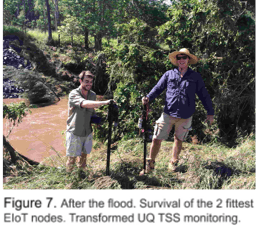
Additionally, installing more sensors immediately bolsters system resilience. UQ installed seven, most got washed away, but with the 2 remaining ones they had strapped to trees, they uncovered colossal insights.
After the flood. Survival of the two fittest EIoT nodes transformed UQ TSS monitoring.
The cons of ad-hoc, IoT fluvial TSS monitoring
 A reactive approach requires an environmental team to predict the event, go on-site, and cable-tie homemade water turbidity sensors to trees. Limiting operationally, though usually feasible, given modern weather forecasting.
These small sensors are not very accurate below 20 NTU. They do not measure background concentrations very well, or in the ocean, lower than 20 NTU. This is not really a limitation as these thresholds indicate extremely clear water, not a meaningful data set for floodwater fluvial sedimentation monitoring.
These small sensors were not designed for field deployment or immersion. They will rust and foul if immersed in water for a few days.
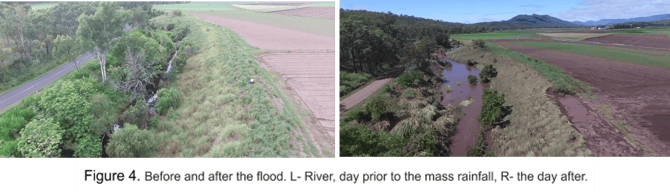
Before and after the flood: Guerrilla turbidity EIoT monitoring
Unprecedented pressure (demography, climate change) forces growing numbers into adopting absolute best practices in water monitoring. Turbidity is central to water monitoring.
Water monitoring systems will likely rest on a combination of methods (sampling stations, laboratory analysis, and EIoT water sensors) for the foreseeable future. By the same token, EIoT adoption, when possible, brings staggering benefits, and can yet be adopted in many more cases.
Using EIoT turbidity monitoring invariably translates to much higher performance, automated alerting for remediation, lower operational costs, and higher predictability and responsiveness.
Even in edge use cases, such as stormwater TSS monitoring, ingenious homemade solutions can bring these benefits. The low-cost aspect of the system is vital, not anecdotal to such projects. Significantly cheaper system engineering allows many more data sources that offer much deeper data sets. 100 lower-cost monitoring units — which are potentially less precise — can cover a greater spatial area and provide more meaningful data than 10 expensive highly precise units.
Conclusion
The cunning handiwork of the civil engineers at UQ can be seen here in detail. But there are still vast amounts of critical water assets out there across the globe, entirely unmonitored. Environmental protection and environmental research will invariably benefit from the democratization of EIoT-based turbidity monitoring.
If you’re looking to elevate your water monitoring, eagle.io’s real-time environmental data management platform can help unlock more meaningful insights.
Contact us to learn about our EIoT platform for consultants and scientists.
- Author: Stephane Malhomme
- Read time: 3 mins
- Region/Location: Australia, Queensland
- Vertical: Coal Seam Gas
- Sectors: Oil & Gas
- Hardware: Campbell Scientific
2023 Insights into Environmental Monitoring
Download nowDetails
- Author: Stephane Malhomme
- Read time: 3 mins
- Region/Location: Australia, Queensland
- Vertical: Coal Seam Gas
- Sectors: Oil & Gas
- Hardware: Campbell Scientific